
Reconstruct Gene Networks Using Shiny
Check out the application! http://trestletech.com:3838/grn/
We’ve been experimenting with RStudio’s new Shiny software as a way to quickly and easily create interactive, responsive web applications which are able to leverage complicated analytics back-ends built in the R programming language.
We created a simple interface which can infer the structure of an underlying Gene Regulatory information based on gene expression patterns; the application is available at http://trestletech.com:3838/grn/. (At the time of writing, Shiny’s file upload functionality is highly unstable and may not work from your machine — hopefully improvements to the project will resolve the issues shortly.)
Technical Details
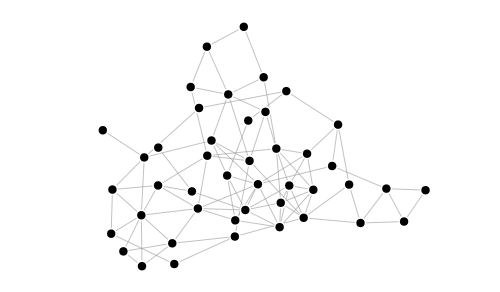
I’m using Shiny/Glimmer to handle all web traffic, and ENA to wrap GeneNet to do the actual network inference (more methods could easily be added later). I used D3’s Force Layout to provide some interactive network visualization — I don’t know that it’s really the most practical way to view the data, but it’s some fun eye-candy.
I had stumbled through a few un-documented features of Shiny (app-specific www directories, JS to handle custom Shiny outputs, fileInput() for uploading data, etc.) — if you find yourself in the same boat, all my source is available on Github here if anyone’s interested.
I had created a custom reactive function in Shiny to handle an adjacency matrix (the preferred format for the ENA package), which will translate the adjacency matrix into an adjacency list which can be properly handled by RJSONIO, which is how Shiny transfers data. I think created the client-side portion in Javascript which is able to parse that JSON and display it in a D3 Force-Directed Graph.